

A Gantt chart is used to plan and track project work over time. It shows when tasks begin and end, how they depend on one another, and how progress compares with the schedule. Its value is not just displaying dates: it makes the sequence of work and potential pressure points visible.
A polished timeline can still mislead if it is crowded, poorly maintained, or built on assumptions that have changed. A Gantt chart is most useful when its level of detail fits the project and its schedule is updated as work progresses.
This guide explains what a Gantt chart shows, how to build one from defined project tasks, and how it supports milestone tracking, resource planning, progress reviews, and critical-path visibility. It also covers common mistakes and the format’s practical limits, helping you decide when a Gantt chart provides a clear basis for coordination and when another view may suit the work better.
Key Takeaways
- Choose a Gantt chart when understanding task timing and dependencies matters; use a different view when work is highly flexible or exploratory.
- Build the schedule around defined tasks, realistic durations, dependencies, and milestones, then select a time scale that keeps the plan readable.
- Use progress and resource information to spot schedule pressure, workload conflicts, and potential effects on the project’s completion date.
- Keep the chart focused and current: excessive detail, unnecessary visual clutter, and outdated assumptions can weaken its value as a planning tool.
What is a Gantt chart?
A Gantt chart is a project management view that places activities against a horizontal time scale. Developed by Henry Gantt in the early 1910s, it makes task timing and relationships visible in one schedule. To understand what a Gantt chart is used for, consider how it connects planned work to deadlines and dependencies.
Displaying tasks and project timing
A Gantt chart lists project tasks vertically and uses horizontal bars to show each task’s start date, duration, and end date. The time scale can show days, weeks, or months, depending on the project’s length and the level of detail needed.
For example, a procurement task scheduled between two dates appears as a bar spanning that period. Its position shows when the work is planned, while its length represents its duration. The chart can also show task owners, deadlines, completion levels, and milestones, giving the team a shared view of the schedule. Readers can quickly distinguish a brief activity from one that occupies a substantial part of the timeline. That is what a Gantt chart is used for: bringing schedule details together in a readable view.
Mapping task dependencies
Dependencies show which tasks must start or finish before other work can proceed. A Gantt chart can connect dependent activities, making it easier to see how a predecessor’s delay could affect later tasks.
For example, design approval may need to finish before procurement begins. If approval is delayed, the linked procurement activity may also shift, creating a bottleneck for later work. Reviewing dependencies helps teams see which tasks can run in parallel and which must follow a specific sequence. It also makes schedule assumptions visible and easier to assess when plans change.
Distinguishing charts from timelines
A timeline presents events or milestones in chronological order. A Gantt chart also shows task durations and, when mapped, dependencies. This distinction matters when readers need to understand not only what happens next, but how long the work takes and what must come first.
A task list names activities but does not inherently show their timing. A spreadsheet can hold dates and owners, but needs a clear layout to show durations and overlaps at a glance. PERT diagrams emphasize task sequence and dependencies in a network view, while Gantt charts make timing legible on a horizontal scale. Kanban boards organize work by status, such as “ready” or “in progress,” and can suit flexible workflows. For a fixed sequence with deadlines, a Gantt chart brings dates, durations, and connected work together.
Steps for creating a Gantt chart
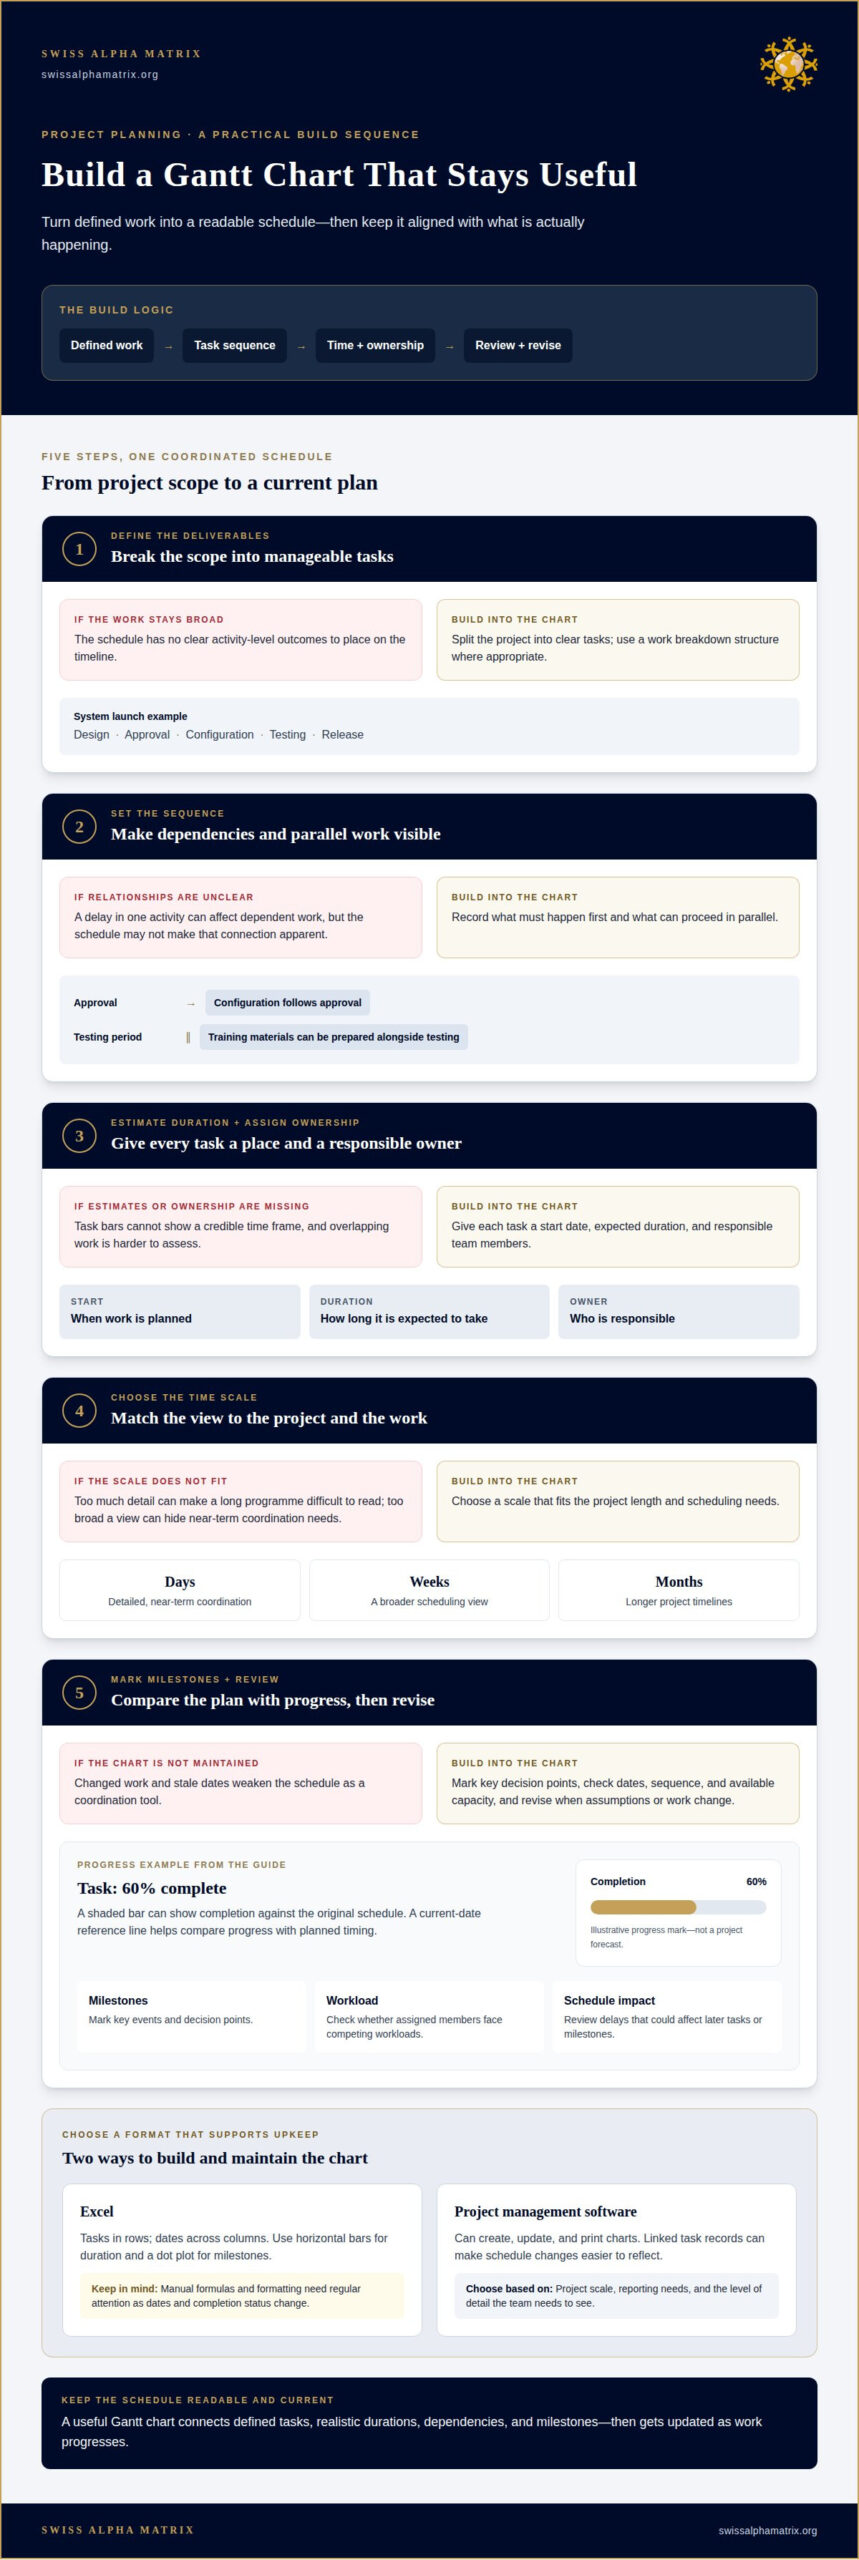
Build the chart from a defined scope, then turn the work into a sequence that can be scheduled and maintained. Each activity needs a clear outcome, an owner, and a credible time frame.
- Define the deliverables. Break the project into manageable tasks, using a work breakdown structure where appropriate. For a system launch, separate design, approval, configuration, testing, and release.
- Set the sequence. Record which tasks depend on others and which can proceed in parallel. For example, configuration may follow approval, while training materials can be prepared alongside testing.
- Estimate duration and assign ownership. Give each task a start date, expected duration, and responsible team members. These inputs determine where each bar will sit and how much work overlaps.
- Choose the time scale. Match the display to the project’s length and scheduling needs. A detailed daily view may suit near-term coordination, while broader timelines can make long programmes easier to read.
- Mark milestones and review the plan. Add key decision points, then check whether the sequence, dates, and available capacity align. Revise the schedule when assumptions or work change.
Excel can list tasks in rows and dates across columns, with a horizontal bar chart showing duration. A dot plot can mark milestones. This approach gives teams control over the display, but manual formulas and formatting need regular attention to keep dates and completion status accurate as tasks change.
Project management software can create, update, and print charts. Linked task records can also make schedule changes easier to reflect. Choose tools based on the project’s scale, reporting needs, and the level of detail the team needs to see. Whatever the format, update the chart regularly: stale dates undermine its value for coordination and scheduling.
For programmes where sequencing, ownership, and revisions require coordinated oversight, complex project management can provide structured support.
Milestones, progress, resources, and critical paths
A Gantt chart compares planned work with current progress across a project schedule. Its marks can help teams identify delays, workload conflicts, and tasks that may affect delivery.
Marking milestones and tracking progress
Milestones mark key events, while progress indicators show how much of each task is complete. A diamond can mark an approval date, and a shaded horizontal bar can show work completed against the original schedule.
In a progress Gantt chart, a task that is 60% complete may be shaded in proportion to its completion. A current-date reference line helps readers compare that bar with planned timing. For example, if testing is behind its scheduled position, the team can assess the effect before the next milestone. Resource details can also reveal whether assigned members face competing workloads.
Showing task relationships
Task relationships connect activities when the timing or completion of one affects other work. A Gantt chart can link a predecessor to a dependent task, making changes in sequence visible as the project advances.
For example, an American project team coordinating design approval and procurement can use a chart to show that purchasing follows approval. If approval shifts, the connected procurement schedule may need to change. Other tasks may proceed in parallel, so the chart helps distinguish a local delay from one affecting several deliverables. These relationships support collaboration by clarifying when one team’s output is needed by another.
Identifying critical paths
The critical path is the sequence of dependent tasks that determines the earliest possible project completion. A delay to a task on this path can push back the planned end date, so tracking its progress supports timely decisions.
A Gantt chart can show critical-path tasks alongside other work, helping managers focus schedule reviews where slippage would have greater consequences. If a resource shortage slows a critical activity, the team can assess whether reallocating capacity or revising the sequence could reduce the impact. The chart brings task duration, relationships, and progress into one view to support that assessment, but it does not replace an informed review of the plan.
Gantt chart best practices and common mistakes
A Gantt chart is useful only when it reflects the project plan and stays current. Its visual should clarify decisions, not simply display every available detail.
Applying Gantt chart best practices
Start with a scope-based task list, then estimate duration using the work involved and known constraints. For high-risk or critical-path tasks, the guide recommends adding a 10-15% time buffer to the estimated duration. This creates room for uncertainty without disguising the assumptions behind each date.
Choose a time scale suited to the project, and use colours only for meaningful distinctions, such as milestones or critical-path work. Remove unnecessary borders and gridlines if they compete with the schedule. Templates can provide a consistent format, but an engineer planning sequential work should tailor task detail and labels to the project’s actual dependencies.
Recognizing common Gantt chart mistakes
A common mistake is treating the chart as self-explanatory. Without mapped dependencies, it may show dates but not how one activity affects another. A spreadsheet or software template cannot fill in missing relationships. For example, an approval task that gates procurement needs a visible link; otherwise, a schedule review may miss the source of a delay.
Excessive detail creates another problem. A plan containing hundreds of tasks can become difficult to interpret, while frequent scope changes can make dates outdated quickly. Keep the primary view focused on decision-relevant activities, and revise it when assumptions change. Avoid using a Gantt chart as the sole control for exploratory work, where the sequence may not be stable. For complex schedules requiring coordinated planning, explore support for complex project management.
Swiss Alpha Matrix
Swiss Alpha Matrix helps stakeholders assess complex programmes where a Gantt chart is one part of a broader execution picture. A schedule can clarify sequence, timing, and dependencies, while project decisions may also require scrutiny of operational assumptions, instruments, and on-ground conditions.
For cross-border financial and investment programmes, Swiss Alpha Matrix provides Complex Project Management, Operational Due Diligence, Audit-Grade Instrument Validation, and On-Ground Verification Services. These capabilities support a more complete view of how work is planned, assessed, and verified, particularly when interdependent activities and exposure call for careful oversight.
If your project schedule raises questions about coordination, validation, or execution, contact Swiss Alpha Matrix to discuss your requirements.
Turn the schedule into a decision tool
Knowing what a Gantt chart is used for matters most when it informs decisions, not merely displays dates. Before relying on a schedule, establish who owns each milestone, how changes are assessed, and which assumptions need review. This discipline turns a timeline into an operational reference: teams can identify when a variance calls for resequencing, more coordination, or a formal decision, rather than treating every date shift as an isolated update.
For complex programmes, consider whether the schedule reflects the conditions governing delivery, including dependencies across teams and evidence needed to proceed. A chart can organize information, but accountable oversight depends on clear ownership and sound judgement. If your project requires support bringing those considerations together, contact Swiss Alpha Matrix to discuss your requirements. A considered planning approach can help you move forward with greater clarity.
Frequently Asked Questions
What is a Gantt chart used for in project management?
In project management, a Gantt chart is used to coordinate scheduled work and assess whether planned delivery remains feasible. For a product rollout, it can help a steering group see whether delayed approval affects launch readiness or whether parallel preparation can continue. That shared view gives decision-makers a basis for directing attention before one missed commitment affects wider delivery.
What are the advantages of using a Gantt chart?
A Gantt chart gives teams and stakeholders a shared basis for discussing delivery instead of relying on separate status reports. For example, a programme lead can use a schedule review to identify which deliverables remain on track and where a decision is needed. This common reference can also clarify hand-offs, since teams can see when their outputs are required by others.
What are the limitations of Gantt charts?
A Gantt chart depends on estimates and task information that can change, so dates may create false confidence if assumptions are not reviewed. The chart can also become difficult to interpret when a large programme involves extensive task detail or frequent revisions. Exploratory work may not follow a stable sequence, making a fixed schedule less informative than a view designed for changing priorities.